")
")
Geographic Information Systems


Geographic Information Systems (GIS) bring together a variety of geographical data with associated spatial data and road network parameters, and can provide graphs showing the results of queries made of the database.
This integration of information helps to manage the data obtained via vehicle-mounted acoustic analysis equipment (curve meter, Ecodyn, LPA), and provides a fast, effective tool for decision-making and for preparing reports and studies.
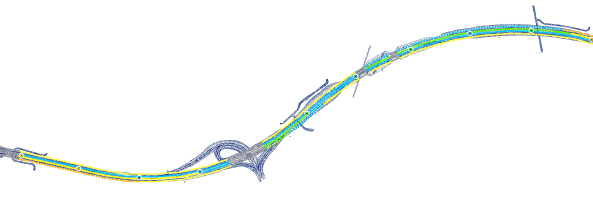
Any measurement that can be taken on a geographical feature can be represented in a GIS: acoustic road analysis is a case in point. GISs enable an abstract representation of the features with which data is to be associated to be drawn up. This simplification of data enables users to interpret them visually on screen or on paper, and thus to assess the information associated with each feature.
On paper intuitive visual reports are obtained, and on screen each point can be examined in detail together with other elements such as video images or still photographs and reports associated with each item. This provides both an overview and a detailed view on whatever level of complexity the user needs. Starting with a cartographic database, we can incorporate the data provided by the acoustic analysis equipment along with any alphanumerical data available. All it takes is the right definition of databases and the establishment of a parameter for linking the tables.
Acoustic road analysis has little effect on fieldwork, since inputting the data into a GIS environment involves no more than generating files in a format that can be read by our environment. The spatial or geographic component comes with the incorporation of GPS data. One of the functions of GPS is to automatically mark points along a route at a time intervals selected by the user. This automatic data acquisition is combined with manual data acquisition to “reconstruct” bypass roads around cities and update obsolete data in databases.
One of the main applications of GIS is for taking inventories.
In some cases query builders are generated that conduct complex searches, selecting fields from the database. This makes for fast, effective updating of changes in databases and their association with maps.
SIG applications in the acoustic analysis and management of roads:
- Measurement of deflection and radius of curvature on road networks using a curve meter.
- Isovalue maps for deflection and IRI on airport runways.
- Measurement of back-reflection with Ecodyn for road markings on road networks.
- Inspection and inventorying of posts and gantries for signage.